On demo mode, use date to work.
In version 13, Wave was added. 13.1 The histogram and trigger line can be changeable.
Wave can be set to 200-500. can have different signal on wave 200
The up-down indicator is no repaint and works on all pairs and lower than weekly time frame charts.
It is also suitable for 1 m charts for all pairs.
and hold a long way to signal.
Don't give too many signals.
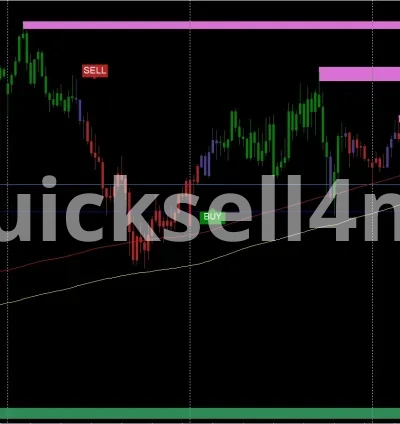
When the red histogram crosses the trigger line, that is an up signal. and price probably will down
When the blue histogram crosses the trigger line, that is a down signal. and the price probably will go up.
When the signal is not seen, press the + button on the terminal.
To see the weekly chart, because of the low data on the chart, it needs to lower the processing value from 1000 to min 500.
Add the c value. default is 2.7
also you can set the signals with the c value increasing or decreasing however you want acordig to the chart
This value needs to change according to the pair you use.
Set the value in the daily period or H4 period to up and down places that have been seen.
After that, use same c value for that pair
You will see sometimes an H4 signal and sometimes 15 m different periods.
When the signal has been seen, any period chart acts according to it.
This system is a mathematical kind of approach to prices to find up and down points.
No reviews found!


No comments found for this product. Be the first to comment!